

Is this the best Mariners lineup ever?
A comparison of 1995, 1997, 2001 and the 2005 Mariners lineups

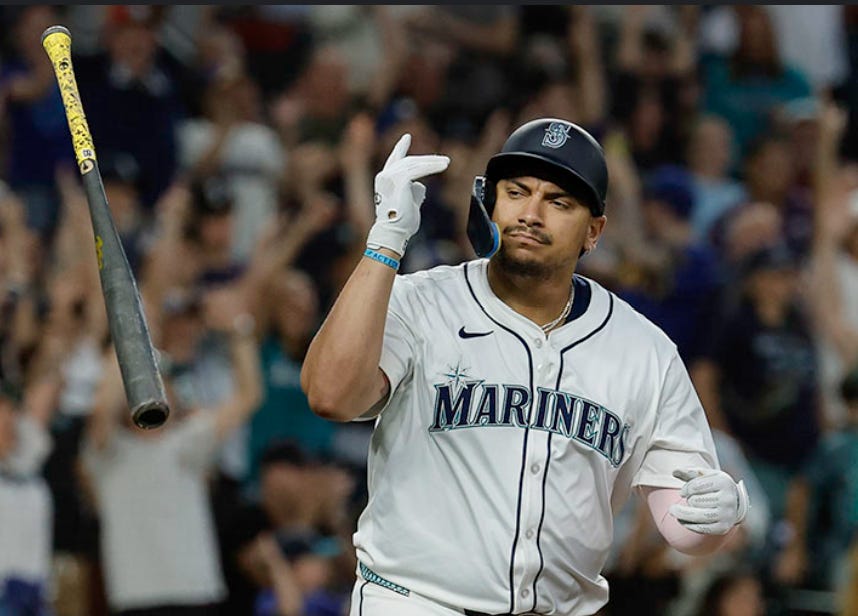
When Seattle Mariners’ fans think back to the best lineups in franchise history, the names Griffey and Edgar are likely etched in their minds. If not, the 2001 team that led baseball in nearly every offensive category would be first off the tongue, led by a muscly Bret Boone and a new upstart right fielder who slapped the ball over the field. But after 2001, there are rare occurances where a die hard (or even casual) M’s fan would say: “man, look at that lineup. We are stacked!”. The 2016 team certainly had an amazing heart of the order with three players hitting 30+ home runs (Cano, Cruz and Seager), but the offensive mediocrity that plagued Safeco/T-Mobile traumatized thousands of ROOT Sports viewers. And then the trade deadline of 2025 came. The talk of Seattle sports now is how good this 2025 team might be or actually is day in and day out. For many fans the trauma is too strong and they just wait with Twitter fingers ready to point out the offensive flaws. However, for many, hope springs eternal. Eternally awesome.
So is the 2025 lineup really that good? Is it possible that we can expect a fun offensive performance nearly every night? Let’s compare this group with the best of the best in Mariners history through August 7th and see how it stacks up. While I will list these four seasons (1995, 1997, 2001, and 2025) in random order, you should be able to figure out which is which based on the information given.
Option A:
LF - .245, 23 HR, 57 RBI, 66 R, 21 SB
C - .248, 42 HR, 90 RBI, 75 R, 13 SB
CF - .254, 21 HR, 62 RBI, 74 R, 22 SB
1B - .289, 14 HR, 65 RBI, 57 R, 21 SB
3B - .239, 37 HR, 90 RBI, 69 R, 2 SB
DH - .255, 18 HR, 53 RBI, 43 R, 5 SB
RF - .287, 7 HR, 17 RBI, 16 R, 2 SB
SS - .265, 9 HR, 44 RBI, 51 R, 6 SB
2B - .252, 3 HR, 16 RBI, 18 R, 1 SB
Option B:
LF - .295, 4 HR, 20 RBI, 48 R, 2 SB (not on team yet)
2B - .289, 1 HR, 20 RBI, 42 R, 11 SB
CF - .263, 7 HR, 15 RBI, 23 R, SB (injured most of the year)
DH - .363, 17 HR, 70 RBI, 80 R, 4 SB
1B - .299, 26 HR, 83 RBI, 62 R
RF - .264, 19 HR, 65 RBI, 48 R
3B - .268, 13 HR, 68 RBI, 34 R
C - .274, 3 HR, 28 RBI, 21 R
SS - .279, 4 HR, 21 RBI, 30 R, 4 SB
Option C:
RF - .333, 6 HR, 54 RBI, 93 R, 38 SB
UTIL (LF) - .296, 4 HR, 38 RBI, 55 R, 29 SB
DH - .305, 15 HR, 73 RBI, 54 R, 4 SB
1B - .308, 14 HR, 68 RBI, 68 R, 2 SB
2B - .327, 26 HR, 104 RBI, 81 R, 2 SB
CF - .261, 17 HR, 73 RBI, 74 R, 24 SB
SS - .251, 4 HR, 46 RBI, 57 R, 2 SB
3B - .245, 11 HR, 50 RBI, 47 R
C - .256, 7 HR, 30 RBI, 32 R
Option D:
2B - .326, 9 HR, 44 RBI, 79 R, 5 SB
SS - .305, 16 HR, 57 RBI, 76 R, 22 SB
CF - .296, 34 HR, 103 RBI, 81 R, 11 SB
DH - .327, 18 HR, 80 RBI, 80 R, 2 SB
RF - .242, 26 HR, 78 RBI, 75 R
1B - .274, 22 HR, 59 RBI, 52 R
C - .274, 9 HR, 54 RBI, 49 R
3B - .284, 16 HR, 57 RBI, 51 R
LF - .246, 1 HR, 13 RBI, 22 R
Did you figure out which option is which year? I am guessing most of you got option B as the 1995 team. An injured Griffey and a late acquistion of Vince Coleman (on August 15th - can you believe that?) changed the lineup. While we have great memories of ‘95, it wasn’t a particulary awesome offensive team. You know what team was? The 1997 team.
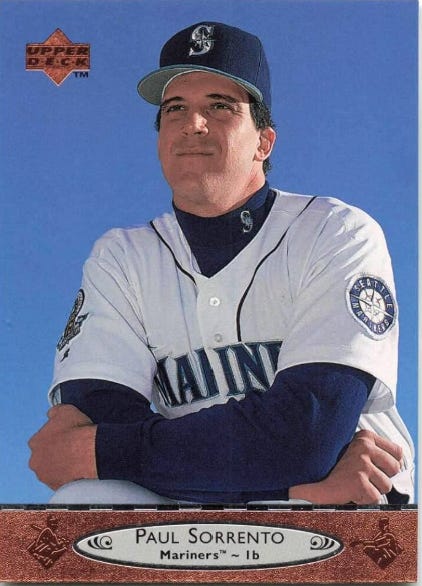
Option D (1997) featured Russ Davis with 16 bombs and Paul Sorrento way better than you remembered (22 homers through August 7 with a .274 average!). And of course, A-Rod, Griffey, Edgar and Buhner in the heart of the lineup. Sick.
The 2001 team was so balanced (option C) but lacks the star power of the other lineups. But a top 5 that all has a .296 average or better is utterly ridiculous. This team was so good in clutch situtations and just kept coming at you. They walked more than they struck out in big spots, they came through with the clutch hit (Ichiro was insane at this) and they were balanced.
But what about 2025? With a 6-1 record since the trade deadline and every game featuring four or more runs, the talk of sports radio and silly Seattle podcasts is how deep this lineup is post Geno and Naylor acquisitions. And it is true. The top six hitters all have 14 or more home runs. Put that in comparison to the other three lineups. Only the 1997 team can match that many players with that power. Move on to RBI and again only the 1997 lineup is better with seven playes at 53 or more (the current lineup has six).
Clearly the older lineups have more .300 or better hitters. However, we need to put that in context. Just as we can’t compare NFL passing yards in 2025 to passing yards in 1981, we must realize that more power comes with more swing and miss. Thus, lower averages. The game is different now - even compared to 2001. Between 1993 and 2009, the Major League average for batting average (say that twice) was in the .270s or .260s. Now it is in the .240s. Amazingly, nearly every Mariner in the 2025 lineup is above league average.
Only time will tell if this 2025 lineup ranks among the Mariner greats. They will have to finish strong and make the playoffs to even be in consideration for most Mariner fans. But just on paper, they are making the case. And so far on the field, the case is getting stronger each day to possibly be the best.
It's odd to have confidence in nine Mariner batters. But confidence vanishes when Garver and Moore play or pinch hit.
Mariners are strong 💪🏼⚾️💪🏼
“Talk to me in October” says the Seattle fan from day one